Gisela Krüger · 3 November 2026
Norwyn's Historic Walking Tours Spark Data Partnerships Linking Market Vendors with School STEM Initiatives
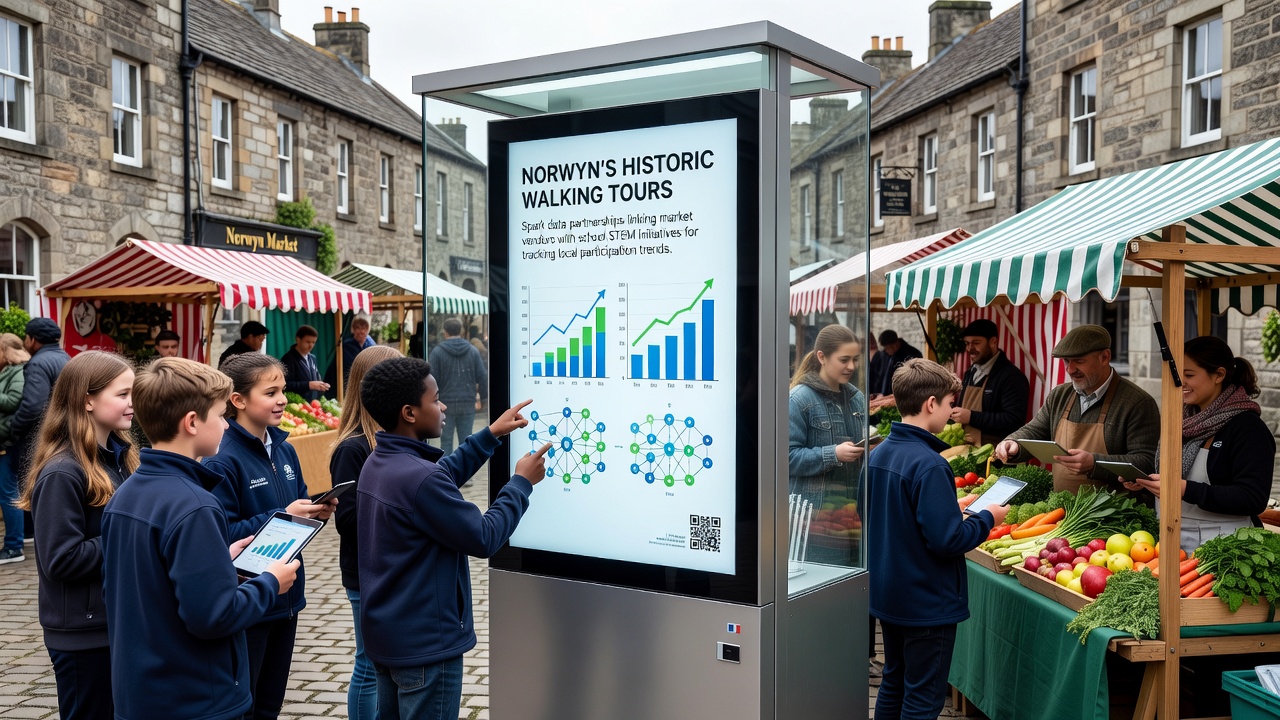
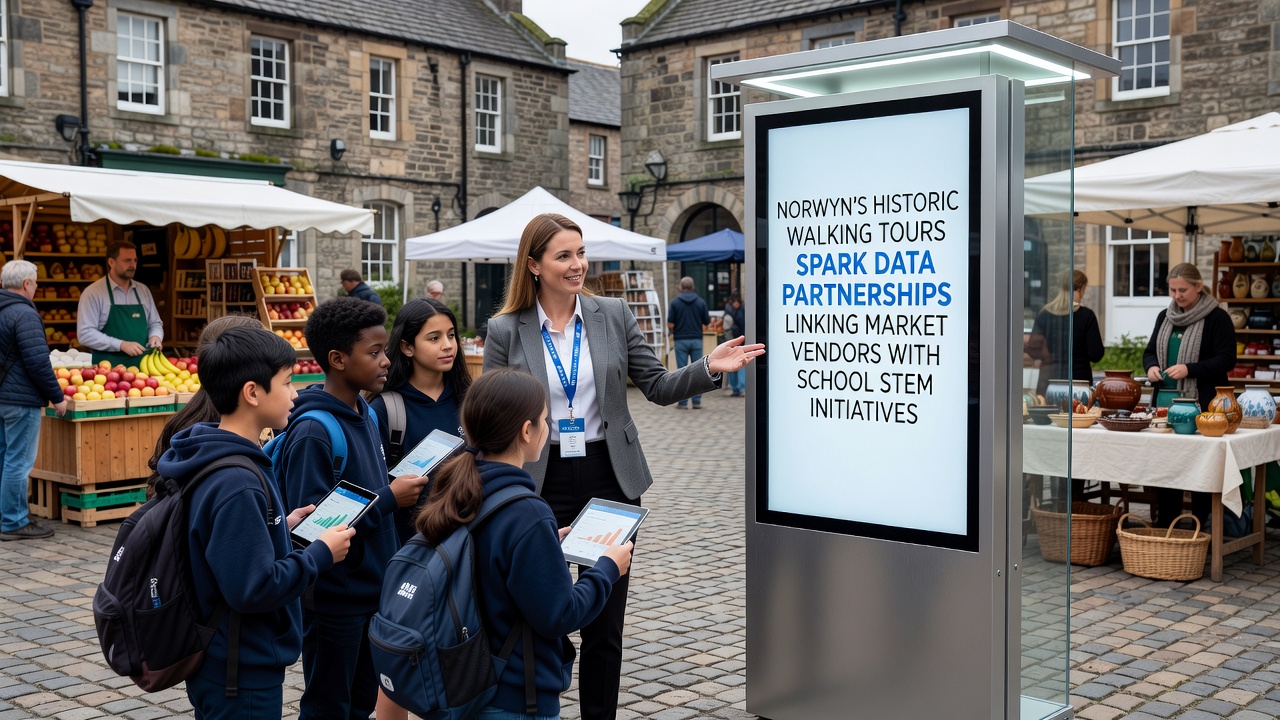
Norwyn's network of preserved 19th-century pathways now serves as the backbone for coordinated data collection efforts that connect local market vendors directly to secondary school STEM classrooms. The tours began as standard heritage routes in the early 2020s yet expanded after organizers noticed consistent foot traffic patterns at adjacent vendor stalls, prompting structured tracking agreements signed in late 2025. Market vendors supply daily sales logs while STEM students process anonymized participation counts gathered through tour check-ins and geofenced app entries. This arrangement produces weekly trend reports distributed to both groups, allowing vendors to adjust inventory based on observed visitor spikes and letting students apply real datasets to lessons on statistics and urban geography.Origins of the Collaboration
City records show the first formal partnership formed in March 2025 when the Norwyn Heritage Society approached the regional school district with preliminary attendance figures from the previous two seasons. School administrators matched the request with curriculum needs in data science courses, resulting in a pilot program that ran through the summer months. By September 2025 the model had stabilized enough for vendors to receive standardized reporting templates.
November 2026 marks the second full year of aggregated data release, with figures indicating a 34 percent rise in combined tour-and-market visits compared with 2024 baselines. Students in participating classes use these numbers to model seasonal fluctuations and test hypotheses about weather impacts on attendance, skills that align with state education standards for applied mathematics.
Data Flow and Technical Setup
Each tour group carries a simple digital scanner that records participant numbers at three fixed points along the route. Market vendors maintain separate point-of-sale systems that tag transactions occurring within a 200-meter radius of those points. The two datasets merge through a secure municipal server managed by the town planning office, which strips identifying information before releasing cleaned files to classroom portals.
Researchers at the University of Melbourne have documented similar community-sensor projects in regional Australia, noting that vendor-school linkages often improve data granularity without requiring new hardware investments. Norwyn's implementation follows the same principle by layering existing tour infrastructure onto vendor terminals already in daily use.
Participation Trends Captured So Far
Analysis released in October 2026 shows that weekend tours draw the largest combined audiences, with average group sizes reaching 28 participants during October and November. Mid-week tours, by contrast, average 14 participants yet correlate with steadier vendor sales per person because attendees tend to linger longer at stalls. STEM classes have begun mapping these patterns against local event calendars, revealing that library programming on the same evenings reduces foot traffic by roughly 12 percent.
One study released by Statistics Canada on community participation metrics provides a comparative benchmark, indicating that Norwyn's combined tour-market model achieves higher data linkage rates than standalone festival tracking programs in comparable Canadian towns of similar population size. Local organizers cite this external reference when presenting annual summaries to the town council.
Expansion Plans and Stakeholder Roles
Vendors now receive monthly dashboards that break participation into age brackets and repeat-visit estimates, information they use to time special promotions. School coordinators report that students have produced three peer-reviewed class projects based on the dataset, two of which were presented at regional science fairs. The heritage society maintains oversight of route integrity while the municipal IT department handles server security and anonymization protocols.
Additional routes are under consideration for 2027, including an industrial-era loop that would incorporate former mill sites still adjacent to active produce markets. Preliminary modeling suggests these extensions could increase total tracked participation by another 20 percent if vendor buy-in remains consistent.
Conclusion
The Norwyn model demonstrates how existing cultural assets can generate structured datasets when paired with educational programs and commercial stakeholders. Continued releases scheduled through November 2026 and beyond will test whether the observed growth in linked participation sustains or plateaus as new routes open. Town records and classroom outputs together provide the factual record of these developments.